5upply Lads - App: Supply Chain
Team 5
Marie Zgurich, Kevin Cornell, Christian Clemmons, Austin Sopha, Audrey Schmitt, Foenix Szot
2/16 Updates
App Description
App Idea: Supply Chain Simulator
The purpose of this app is to educate middle and high school students on the supply chain and all of its complexities within the Upper Peninsula. In particular, the app will focus on the supply and demand of an important local resource: <product>. There is no end goal to this application, making it act more like a “sandbox” simulation with a focus on supply chain mechanics. Our supply chain is represented as a node network, where each node is categorized as either Supply, Demand, or Distribution. Supply and Demand nodes are configured & placed by the application, where Distribution nodes are placed and customized by the user. The overall configuration of these nodes affects how various factors are affected depending on the values inputted. Here is the breakdown of the three different node types:
a.) Supply Node: Produces <product>to be transported. Can only be linked to 1 distribution node. Very costly to transport goods from a supply node to a distribution node. All supply nodes have the same supply rate (determined by application)
b.) Distribution Node: Takes incoming supply and transports them to demand nodes. Can intake from up to 3 supply nodes. Number of demand nodes that can be reached by this node is determined by the user’s configuration. Environmental impact is determined by the user’s configuration.
c.) Demand Node: Represents the consumers’ demand. Placed & configured by the application. Receive supply from distribution nodes. Demand amount is determined by application.
The user’s configuration of the distribution nodes will affect several factors that determine the effectiveness of the network. These factors are defined as follows:
a.) Budget: Everything costs money. Users must be able to see how expensive their distribution configuration is in order to determine the effectiveness of their supply chain.
b.) Environmental Impact: Fossil fuel emissions are a hot topic in today’s climate. Users must be able to see the environmental impact that their distribution network has.
c.) Supply: No good is infinite. Users must be able to view the amount of <product>their Supply nodes are producing in order to make educated decisions about how to further configure their distribution nodes.
d.) Demand: Users must figure out a way to configure their distribution nodes in order to meet the demand determined by the application.
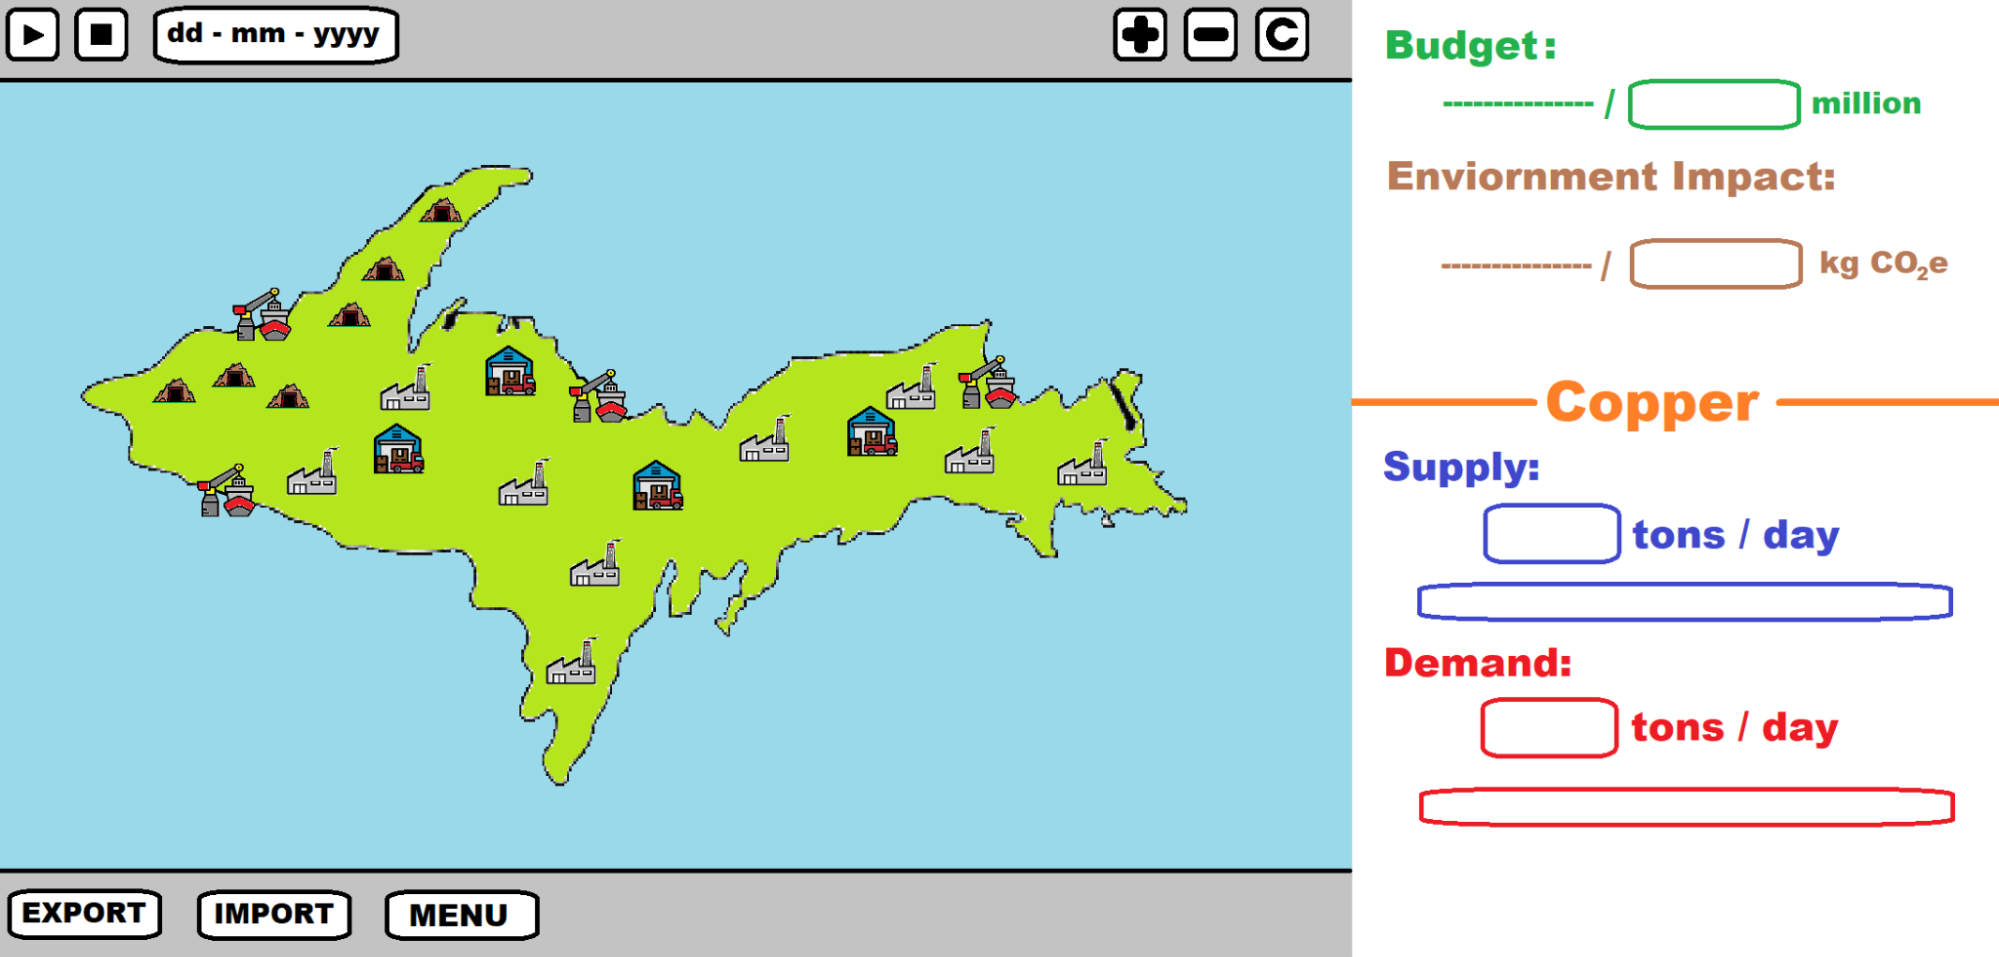
Visualization:
**NOTE: “Copper” should be changed to “<product>” in application implementation
Users: Middle & High School students (ages 11-13+)
Technological knowledge may vary, but the idea is to make it where most students can use it. We want to create an app that is easy to use and easy to understand.
App Usage: Students in Hancock schools will be able to use our app to learn about and model a hypothetical supply chain and how many different events (i.e. natural disasters) as well as the connection between supply and demand can affect the supply and demand of <product>in Michigan’s Upper Peninsula.
Our Proposed Gameplay Loop:
Data: The application will not collect and store any data from the user. However, users will be able to “save” their supply chain node network in case they want to come back to it later. They will also be able to “export” the supply chain state so that it can be shown to teachers to grade or study. The app will use fictional data based on real world events and calculations in the Upper Peninsula and the process that <product> goes through when being distributed. The time scale for the data can be manipulated to keep the simulation engaging. For instance, creating a time slider to speed up or slow down, a way to pause, and to go back in time in order to fix mistakes or test for a different outcome.