CS3331 Grade Listing

Important Notes
A blank entry in the grade is a missing grade,
which means you did not submit a program or did not take an exam.
A zero (i.e., 0) entry indicates that you received a zero
for that program or exam.
You will not receive a passing grade in
the course unless you receive a passing grade on the exams
alone (i.e., 60%). Likewise, you will not
receive a passing grade in the course unless you receive a
passing grade on the programming assignments alone
(i.e., 60%).
If you receive a * next to
Prog/Avg,
Exam/Avg, or
Avg, you should work harder for
the remaining programming assignments and exams, because
you are failing.
|
|
Always check if the recorded grades are identical to those
marked on the graded programs and papers.
|
CS3331 Grade Report
December 22, 2020

0        : program did not compile or did not run
space: no submission
W      : Withdraw

          50  100   50 100 100   70 100 100  200
 No.  S  PG1  PG2  PG3 PG4 PG5  PG6 EX1 EX2 Final Grade
=======================================================
   1      49   67   50  98  98   64  66  28   93  BC
   2 W    48  100                    23   0
   3          100    0  66  97   70  50  67   47   D
   4      50   30   50 100 100       54  52  135   C
   5 W    50   77   49               36  30
   6      50   80   50 100  98   69  54  55   83  BC
   7      45   50   50  90 100   70  51  50   70   C
   8      50  100   49  99 100   70  71  66  130   A
   9      48  100   39 100  85   70  47  84  102   B
  10      49   99   49 100 100   70  72  46  149   A
  11      36  100   50 100  85       42  53   69  CD
  12      48   79   44  94  65       55  18   66   D
  13      49  100   50 100 100   70  69  81  100  AB
  14      49  100   49 100  98   70  42  62  116  AB
  15      50  100   50  98  99   70  62  70  114  AB
  16      50  100   49  90  85   44  38  21   70  CD
  17      50  100   45  98 100   24  71  23   88  BC
  18      49  100   49 100 100   70  45  18   48   C
  19      26  100   49 100       70  39  66   55   D
  20 W                               44
  21      50  100   50  90 100   34  81  80  127  AB
  22 W    48   20                    49  56
  23 W    49                         41
  24      50   99   50 100  98   70  79  76  120   A
  25 W
  26      50  100   49  90 100   70  51  63  112  AB
  27 W                                6
  28      45   65   50  96  90   69  59  23   84   C
  29      49  100   50  70  88   70  52  49   91  BC
  30 W    49   70   31 100 100   70  17   0
  31      47  100   50  96  98       68  72  111  B
  32      49   79   48  96  45   24  49  53   70  CD
  33      42   79   50  96 100   34  72  29   67   C
  34      50  100   50 100 100   64  84  98  145   A
  35 W
  36      49  100   50 100  98   70  68 100  108   A
  37      47   40    0               39            F
  38 W    50
  39      50  100   49 100 100   70  60  59  155   A
  40      49   99   50  98  98   66  51  62  127  AB
  41      39   15   50  86  98   50  48  53  101  CD
  42      50  100   50 100 100   70  87  83  101   A
  43      49  100   49 100 100   70  72  80  103  AB
  44      45   85   49  79  83   64  48  60   73   C
  45      42        49  31   0   70  66  95  103   D
  46 W
  47 W    48    0   49               42   8
  48      48   60   50  81 100   24  82  46   71   C
  49      50  100   50 100 100   64  92  85  141   A
  50      50  100   49  90  99   70  62  31  104   B
  51      44    8   44  90  77    0  48  12   52   F
  52 W
  53 W    50                         39
  54 W    47
  55      46   10       74  63    0  43  18   62   F
  56      50  100   50  90 100   70  65  69  134   A
  57      36  100   50 100 100   70  92  65  143   A
  58 W    50  100       96           39  16
  59      49   90   50 100 100       91  95  110  AB
  60      50  100   50  98 100   70  41  55   99   B
  61      49   46   50   0 100   70  88  69  107   C
  62      47   80   49 100 100   68  48  56   52  BC
  63 W
  64      48  100    0  90 100   64  47  10   64  CD
  65           65   49 100  83   64  34  68  122   C
  66 W    48
  67 W
  68      49  100   49               37  31        F
====================================================
Min       26    0    0   0   0    0   6   0   47
Max       50  100   50 100 100   70  92 100  155
Average   47   81   46  91  92   60  55  52   98
Median    49  100   49  98 100   70  51  56  101
StDev      4   29   12  18  18   19  19  27   30
Grade Distribution
Four students failed this course.
Of these four, two did not attend the final exam.
As a result, only two students (out of the four failed students),
who have completed all programming assignments
and all exams,
failed.
These two failed this course because they received low or very low programming
scores and/or exam scores.
Don't you believe that one of them received only 5 points out of 200!
I feel sorry for them as they may have tried very hard to pass but could not.
You paid so much, but you seem to me did not work hard enough
to earn the needed credits.
As I have mentioned to you over and over again,
I am very serious about this course
and will maintain the same standard I have been using in the past eight
years.
In what follows, two final distribution graphs are shown.
Of these two distrubutions, one excludes those who did not complete this copurse,
while the other includes all students on the roster.
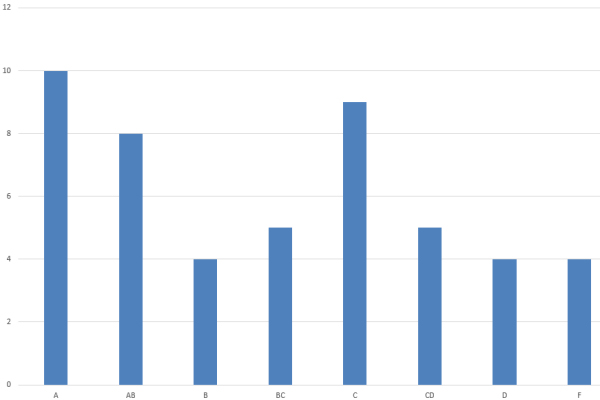
Grade Distribution (All Enrolled Students)
| Grade |
A |
AB |
B |
BC |
C |
CD |
D |
F |
| % |
20.41 |
16.33 |
8.16 |
10.20 |
18.37 |
10.20 |
8.16 |
8.16 |
Total Students = 49, Passed = 91.8%, Failed = 8.16%
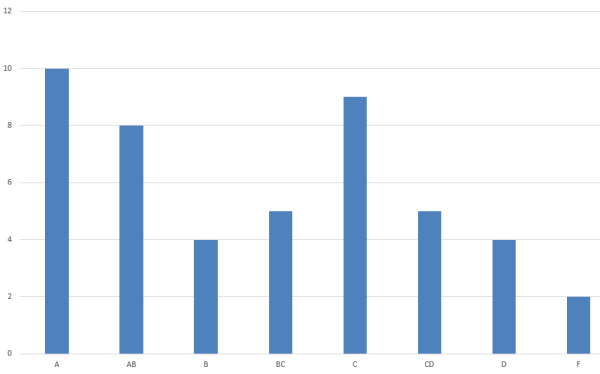
Grade Distribution (All Completed Students)
| Grade |
A |
AB |
B |
BC |
C |
CD |
D |
F |
| % |
21.28 |
17.02 |
8.51 |
10.64 |
19.15 |
10.64 |
8.51 |
4.26 |
Total Students = 47, Passed = 95.74%, Failed = 4.26%
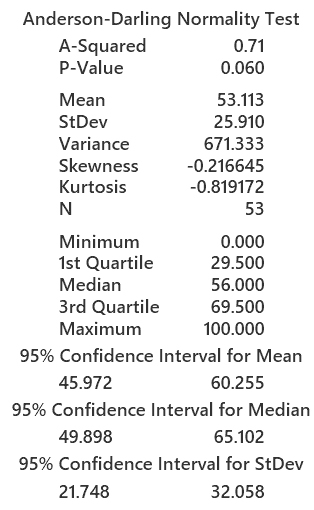
How to Interpret the Exam II Scores
The following is a table showing the class performance of Exam II.
Here is a graphical summary.
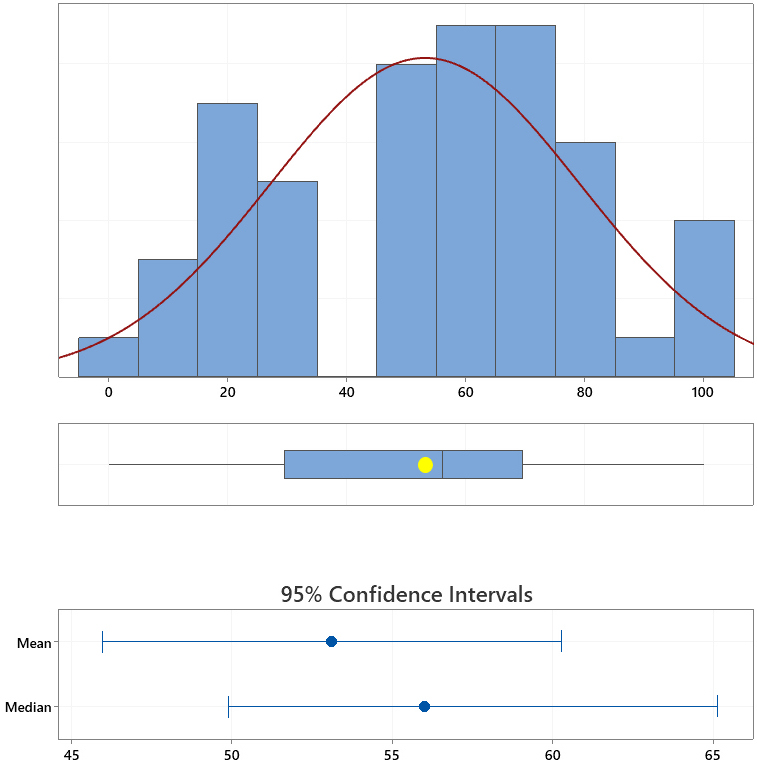
Here is a way of interpreting the above results.
- The p-value of the Anderson-Darling Normality Test of 0.060,
which is very slightly larger than 0.05.
Thus, we have very weak evidence to reject the null hypothesis that the score
distribution is normally distributed.
Note that the mean and standard deviation are 53.11 and 25.91, respectively.
- The graph in the middle is a boxplot of the scores of Exam II.
The boxplot uses the same scale as the that of the distribution plot.
The mediann, the vertical line segment that divides the horizontal box,
indicates that the score in the middle is 56.
That is, there are about 50% scores higher than 56 and also about 50% scores lower
than 56.
The left and right ends of the horizonal box shows the first and third
quartiles Q1 and Q3, respectively.
This means there are about 25% of scores lower than 29.5 (i.e., Q1 = 29.5)
and about 25% higher than 69.5 (i.e., Q3 = 69.5).
The mean (i.e., 53.11) is lower than the median 56.
The median is usually referred to as the second quartile Q2.
The mean 53.11 being lower than the median 56 suggests that
the lower half has a higher weight than the upper half.
More importantly, even though we have more people who performed rather good,
their better performance could not offset the negative impact from the
lower half, in paeticular from those below the first quartile.
- The location of the median in the boxplot suggests that there are
more higher scores (i.e., above the median) than the lower ones.
However, as mentioned earlier, the lower scores are way too low!
- The IQR,
or Interquartile range, is the range between the first and
third quartiles, i.e., IQR = Q3 - Q1.
In our case, because the first and third quartiles are 61 and 26, respectively,
IQR = Q3 - Q1 = 69.5 - 29.5 = 40.
The IQR includes 50% of the scores!
A small IQR means a more concentrated distribution of the scores around the median.
- The two line segments at both ends of the horizontal box are whiskers.
The left whisker represnts the lower 25% of the scores
(i.e., scores from Q1 down to the lowest non-outlier scores).
The right whisker represnts the upper 25% of the scores
(i.e., scores from Q3 down to the highest non-outlier scores).
In our case, the left whisker goes from 0, the lowest non-outlier, to Q1
= 29.5, and the right whisker goes from Q3 = 69.5 to the highest
non-outlier score 100.
- What is an outlier?
In statistics, an outlier is an observation that is distant from other
observations.
An outlier may be due to measuring error, experiment error, corrupted dataset,
or even a correct but unusualy and extreme point.
Outliers in a boxplot are usually shown as small dics or asterisks.
- How to identify outliers?
There are several commonly used methods for identifying outliers.
The graph above used a simple technique based on IQR.
Here, a data point is an outlier if it is more than 1.5*IQR above the third quartile
Q3 or below the first quartile Q1.
More precisely, a score is less than Q1 - 1.5* IQR or greater than
Q3 + 1.5*IQR is an outlier.
A score higher than Q3 + 1.5*IQR is no doubt an outstandingly good one.
However, a score lower than Q3 - 1.5*IQR definitely indicates a very
unsatisfactory performance.
In our Exam II score dataset, we have L = Q1 - 1.5*IQR = 29.5 - 1.5*40 = -30.5
and R = Q3 + 1.5*IQR = 69.5 + 1.5*40 = 129.5.
Hence, all scores are in the range of [L, R] = [-30.5, 129.5]
and there are no outliers.
- A student whose score is
below Q1 has a very high risk of failing this course.
Therefore, do your best so that your performance is above Q1.
- The last two scales are 95% confidence intervals.
The first one has the range of the true but unknown mean of this exam,
which is from about 46 to around 61.
The second one has the range of the true but unknown median of this exam,
which is from slightly lower than 50 to slightly higher than 65.
How to Interpret the EXAM I Scores
The following is a table showing the class performance of EXAM I.
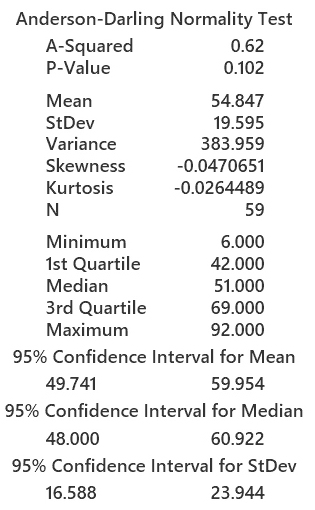
Here is a graphical summary.
Here is a way of interpreting the above results.
- The p-value of the Anderson-Darling Normality Test of 0.102 indicates
that we cannot reject the null the null hypothesis.
As a result, we cannot reject the score distribution being normal.
- The graph in the middle is a boxplot of the scores of the current performance of this class.
The boxplot uses the same scale as the that of the distribution plot.
The mediann 51, the vertical line segment that divides the horizontal box,
indicates that the score in the middle is 51.
That is, there are about 50% scores higher than 51 and also about 50% scores lower
than 51.
The left and right ends of the horizonal box shows the first and third
quartiles Q1 and Q3, respectively.
This means there are about 25% of scores lower than 42 (i.e., Q1 = 42)
and about 25% higher than 69 (i.e., Q3 = 69).
The mean (i.e., 54.847) is higher than the median 51.
The median is usually referred to as the second quartile Q2.
More importantly, even though we have more people who performed rather good,
their better performance could not offset the negative impact from the
lower half, in particular from those below the first quartile.
- The location of the median in the boxplot suggests that there are less
higher scores (i.e., above the median) than the lower ones.
However, as mentioned earlier, the lower scores are way too low!
- The IQR,
or Interquartile range, is the range between the first and
third quartiles, i.e., IQR = Q3 - Q1.
In our case, because the first and third quartiles are 42 and 69, respectively,
IQR = Q3 - Q1 = 69 - 42 = 27.
The IQR includes 50% of the scores!
A small IQR means a more concentrated distribution of the scores around the median.
- The two line segments at both ends of the horizontal box are whiskers.
The left whisker represnts the lower 25% of the scores
(i.e., scores from Q1 down to the lowest non-outlier scores).
The right whisker represnts the upper 25% of the scores
(i.e., scores from Q3 down to the highest non-outlier scores).
In our case, the left whisker goes from 6, the lowest non-outlier, to Q1
= 42, and the right whisker goes from Q3 = 69 to the highest
non-outlier score 92.
- What is an outlier?
In statistics, an outlier is an observation that is distant from other
observations.
An outlier may be due to measuring error, experiment error, corrupted dataset,
or even a correct but unusualy and extreme point.
Outliers in a boxplot are usually shown as small dics or asterisks.
- How to identify outliers?
There are several commonly used methods for identifying outliers.
The graph above used a simple technique based on IQR.
Here, a data point is an outlier if it is more than 1.5*IQR above the third quartile
Q3 or below the first quartile Q1.
More precisely, a score is less than Q1 - 1.5*IQR or greater than
Q3 + 1.5*IQR is an outlier.
A score higher than Q3 + 1.5*IQR is no doubt an outstandingly good one.
However, a score lower than Q3 - 1.5*IQR definitely indicates a very
unsatisfactory performance.
In our current score dataset, we have L = Q1 - 1.5*IQR = 42 - 1.5*27 = 1.5
and R = Q3 + 1.5*IQR = 69 + 1.5*27 = 109.5.
Hence, all scores are in the range of [L, R] = [1.5, 109.5]
and there are no outliers.
- A student whose score is
below Q1 = 42 has a very high risk of failing this course.
Therefore, do your best so that your performance is above Q1.
- The last two scales are 95% confidence intervals.
The first one has the range of the true but unknown mean of class performance,
which is from 49.74 to 59.85,
The second one has the range of the true but unknown median of this exam,
which is about 48 to slightly less than 60.92.
How to make a case regarding your graded programs and exams?
- We anticipate that grading related problems will
surface throughout this semester. If you disagree with
what the grader did, you should do the following:
- Explain why you are correct. Show me a
convincing argument. Something like "I did
this and this by accident" and "my program
ran fine on my machine and/or on one
of the lab machines" are not
acceptable excuses. You must show the grader
missed something. Note that the grader only
grade what you have in the program and
its output.
- Mark those places you may disagree with the
grader and print a detailed note
explaining why you are correct.
- Staple your graded program and your printed notes
available in my mailbox in the Department
office.
- I will make a decision regarding if a
re-grade is necessary.
- You can make a case within one week from the day the
graded programs are available for pickup. After this
seven-day period, I will assume you accept the
recorded grade.
- You should follow the same procedure to request an exam
regrade.
|